Data Dashboard Solutions for Smarter, Faster Business Decisions
Unlock the Power of Your Business Data — Visualize, Analyze, and Act with Confidence.
Discover Clarity in Chaos
Managing a small business comes with overwhelming data — sales numbers, customer behaviors, marketing performance, and inventory flow. But raw numbers mean nothing without clarity.
That’s where Streamcoodrs’ Data Dashboard Solutions step in.
Our intelligent, customizable dashboards convert your scattered data into beautiful, interactive visuals that tell you exactly what’s happening and what to do next. No more spreadsheets, guesswork, or time-wasting reports.
With one glance, you’ll know where to focus, how to grow, and what to fix.
Why Choose Streamcoodrs’ Data Dashboard Solutions?
We don’t just show data.
We help you feel it — clearly, visually, and instantly.
Real-Time Monitoring
Stay Ahead of the Curve.
Track your KPIs and metrics in real time — know what’s happening as it happens. From sales spikes to sudden drop-offs, get alerted instantly and stay in control.
Customizable Dashboards
You Choose What You See.
Every business is unique. Our dashboards are fully customizable to fit your operations — from revenue, expenses, and customer journey to marketing funnels and fulfillment stats.
All-in-One Data Integration
Bring It All Together.
Pull data from multiple sources: Google Sheets, Excel, ERPs, CRMs, APIs, eCommerce platforms, and more — all visualized in one clean dashboard.
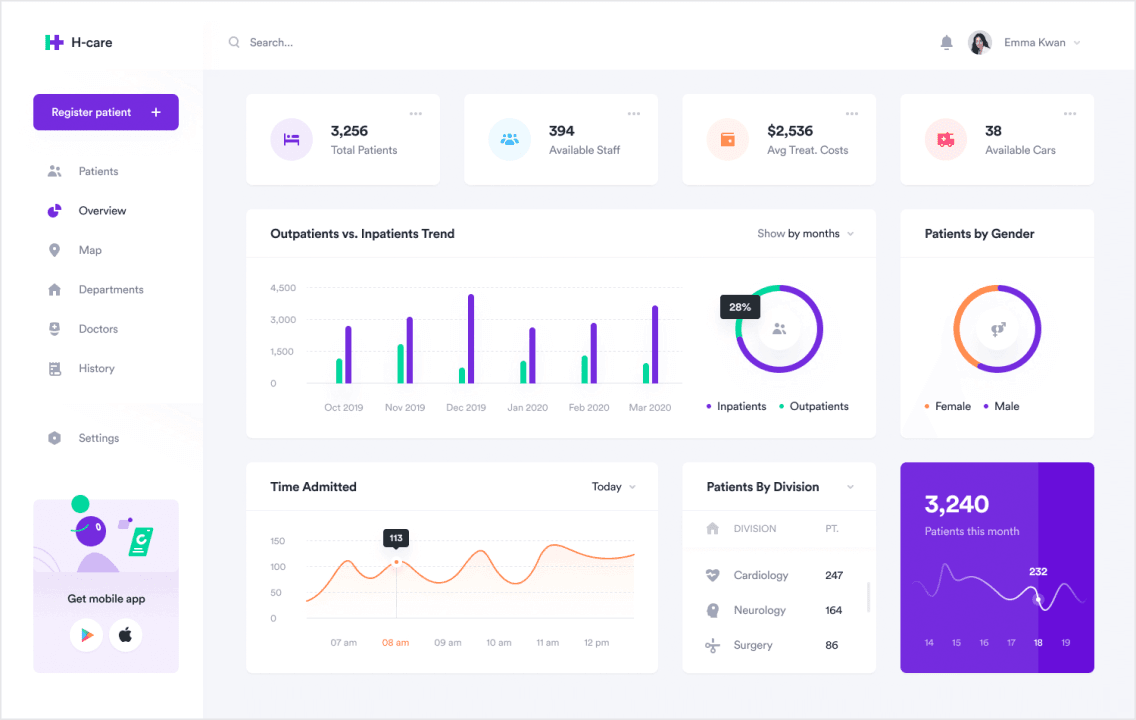
Powerful Data Visualization Dashboards
Make Sense of Every Metric.
Don’t just stare at rows of numbers. Let our Data Visualization Dashboard translate your performance into dynamic charts, graphs, heat maps, and more — so your team sees the story behind the stats.
Mobile & Desktop Friendly
Access Anywhere, Anytime.
Your business doesn’t stop when you leave the desk — and neither should your dashboard. View and interact with your data seamlessly from any device.
Enterprise-Grade Security
Your Data Is Safe With Us.
Streamcoodrs provides top-tier security with encryption, secure access roles, and audit trails — giving you peace of mind, always.
Who Is This For?
Our solution is tailored to help small business owners and entrepreneurs who want to:
Eliminate confusing spreadsheets
Understand what drives profits
Make decisions based on real-time data
Improve team performance and visibility
Save hours every week on reporting
Grow with confidence
Also ideal for:
eCommerce Stores
Marketing Agencies
Finance & Operations Teams
Startups & SaaS Companies
What You’ll Gain
Faster, confident decisions
Time-saving automation
A clearer picture of performance
Better team alignment
Happier customers
Higher profits
The Emotional Difference
Imagine opening your laptop and instantly seeing everything you need to know about your business — beautifully visualized, neatly organized, fully updated.
No stress. No confusion. Just clarity.
Feel in control. Feel confident. Feel focused.
That’s the Streamcoodrs difference.
Ready to Take Control of Your Data?
Order Your Data Dashboard Solution Today
Turn complex data into simple, visual insights that drive growth. Get started in minutes with ready-to-use templates — or customize from scratch.
Shop Now – Your Smarter Business Starts Here!
Need help choosing the right setup? Talk to our experts — we’re here to help.
| Feature | Basic Package | Standard Package | Premium Package |
|---|---|---|---|
| Best For | Startups or internal teams needing simple insights | Small to medium businesses needing connected dashboards | Enterprises or SaaS platforms needing real-time, complex data systems |
| Dashboard Type | Static dashboard or Google Sheets-based | Connected dashboard with APIs or SQL | Real-time, fully dynamic multi-source dashboard |
| Tools/Stack | Google Data Studio / Google Sheets / Notion | Power BI / Tableau / Superset / Metabase | Custom React / Next.js / Dash + APIs / BI tools |
| Data Sources | 1–2 manual data sources | Up to 5 data sources (APIs, databases, CSVs) | Unlimited sources (SQL, APIs, CRM, eCommerce, analytics, etc.) |
| Visuals & Charts | 4–6 basic visuals (bar, line, pie, KPIs) | 8–12 advanced visuals (maps, funnels, filters) | 20+ dynamic components with drill-down, filters, charts |
| Custom Branding | ✖️ | Branded layout (logo, theme, fonts) | Fully branded, white-labeled dashboard |
| Interactivity | Filters & selectors (basic) | Interactive filters, slicers | Fully interactive (user logins, drilldowns, dynamic views) |
| Authentication | ✖️ | Admin access link or password-protected | Role-based access (admin, analyst, viewer) |
| Data Refresh | Manual (on edit or upload) | Daily or scheduled refresh | Real-time refresh (via API/webhook) |
| Integration | ✖️ | Connect CRM, Google Analytics, eCommerce | Custom integrations with Stripe, Salesforce, SQL, Airtable, etc. |
| Mobile-Friendly | Basic responsiveness | Fully responsive layout | Optimized for web + tablet/mobile views |
| Documentation | ✖️ | Setup guide or walkthrough | Full user & technical documentation |
| Support & Revisions | 5-Day Support, 1 Revision | 14-Day Support, 2 Revisions | 30-Day Support, 3 Revisions, onboarding |
| Delivery Time | 5–7 Days | 10–14 Days | 20–30 Days |
| Price | $300+ | $800+ | $1,800+ |


Reviews
There are no reviews yet.